1st off...my apologies for my absence of late. It's been a roller coaster of a ride the past few months that has ultimately landed me on Cloud 9. Like Buddy Elf getting a job in a toy department, I have landed a role as a Sales Consultant with Tableau Software. Without turning this into a marketing pitch, Tableau has allowed me to explore data in ways I was never able to before, and best of all it allows me to do so without breaking the best practices laid out by the many mentors I look up to.
So, you may see some more Tableau specific blog posts moving forward. I will still aim to write about data visualization best practices, while I incorporate more Tableau to help SHOW my points.
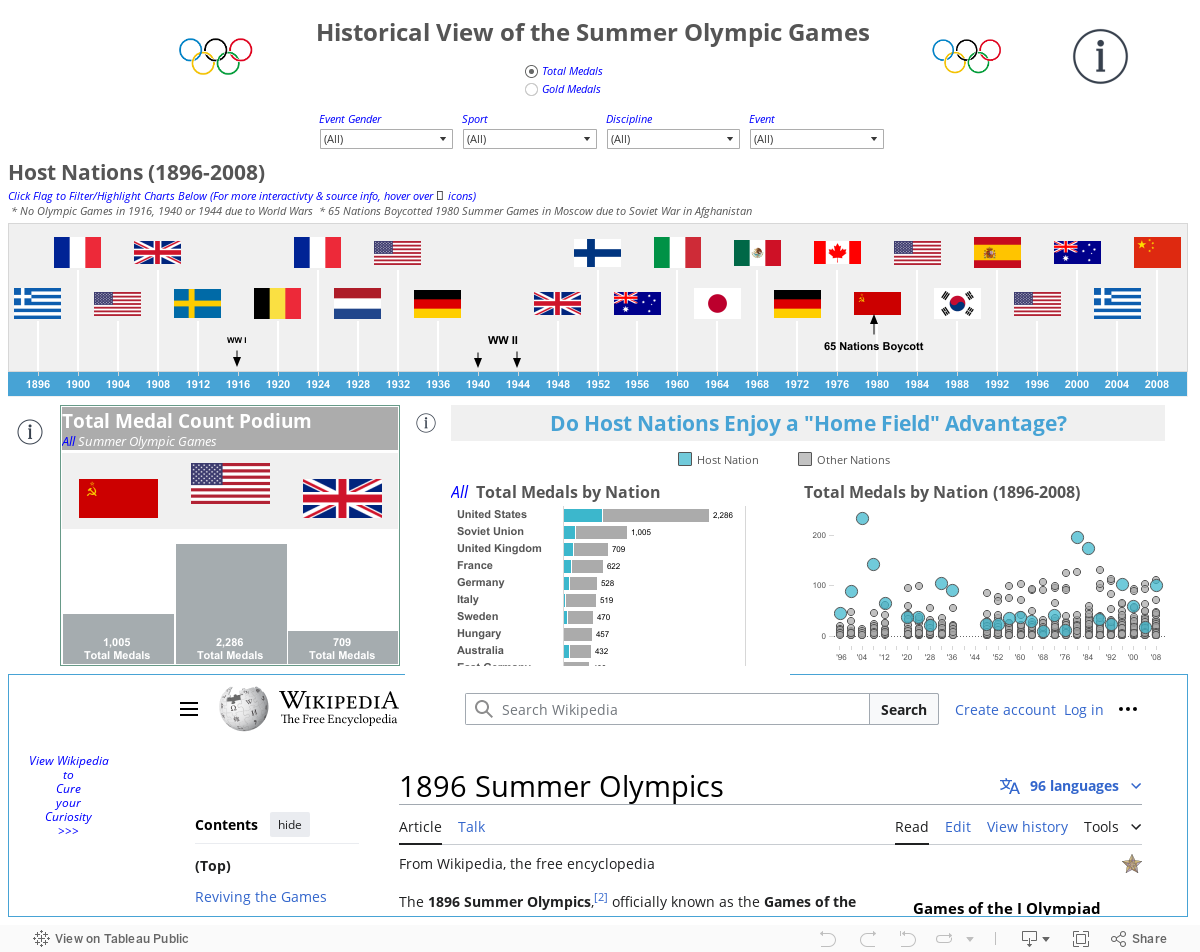
Best part about the new job, visualizing what's relevant and interesting (at least to me). For one of my first assignments I got to do just that so I decided to explore some Summer Olympics data since Rio 2016 is fast approaching (I apologize again that my data only goes through 2012...feel free to download and add 2012 data as your time permits).
I won't go too deep into what I found as I want you to explore for yourself. But some interesting things that I found:
- The gaps in the data are as interesting as the data itself (WWI, WWII, Soviet War)
- I'm a hockey fanatic and I never new that Ice Hockey debuted in the Summer Games (1920), not the Winter Games (who woulda thunk?)
- Do not mess with France, the only western nation on the podium for Judo
- in 1920 and 1956, the games were hosted in multiple nations
- Women were not welcome to participate in the 1896 games in Athens, Greece
- Nations come and go
I had a lot of fun developing this dashboard, incorporating data joins, dashboard actions, annotations, LOD calculations, string concatenations, custom shapes, dual axes, hidden charts, dynamic titles, hover over info buttons, parameters, unicode text, hyperlinks and much more.
My curiosity got the best of me on this one and I hope it will do the same for you...hence the WIKI link at the bottom of the dashboard.
If you have any ideas for enhancement or you're interested in knowing how to build dashboards like this with your data in Tableau, please comment below!
Cheers,
Kevin Taylor
Here's a link to the dashboard on Tableau Public in the event you have issues interacting.
Here's a link to the dashboard on Tableau Public in the event you have issues interacting.